


Report presentation templates from Genially
Dreading your next financial presentation or quarterly business report? Data has a tendency to be dense, dry, and painfully dull – as anyone who’s dozed their way through an accounting presentation will testify. Avoid the same fate with a beautifully visual report deck that your colleagues, directors, and investors will engage with and even enjoy reading (yes, it’s possible!).
Genially reporting templates help you put an impressive data-driven presentation together in minutes. Choose from our range of customizable designs for marketing reports, budget reviews, project status reports, sales reports, social media reports, and more.
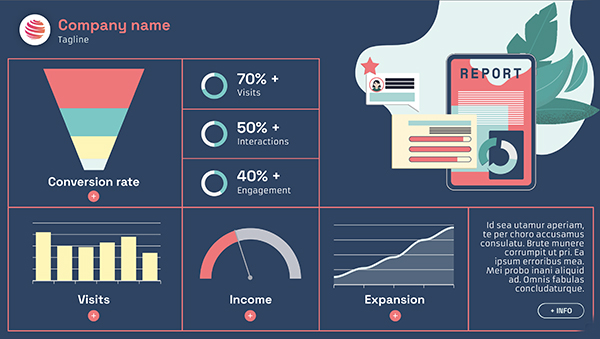
Each slide deck template includes animated data visualizations and interactive charts so you can summarize results and present your KPIs in an accessible, easy-to-follow format. The eye-catching, animated designs help you bring numbers to life on the screen. As a result, it’s easier to share key insights and financial projections without team members losing focus or interest.
Not the most artistic person in the world? No problem. Our team of pro graphic designers have done the creative work for you. Just drop in your text, insert your data, and your slides are pretty much ready. Keeping a close eye on your budget? Good news: every report template on this page is 100% free to use.
What’s an interactive report?
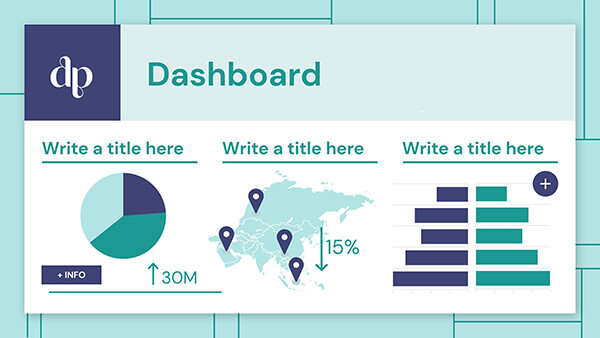
Interactive reports contain clickable charts, dashboards, and pop-ups that allow your audience to scroll, click, and explore information like a website. Unlike Powerpoint reports and finance slides made with standard office software, Genially report decks are fully responsive with clickable infographics and immersive designs.
An interactive slide deck is significantly more engaging than a spreadsheet or PDF report. Instead of blocks of text and tables of statistics, your readers get digestible nuggets of information in the form of pop-up windows, labels, interactive charts, and even audio or video.
Responsive reports give readers the chance to understand complex data at their own pace. They’re more likely to walk away with a clear picture of how things are going, and a solid understanding of the next steps.
With Genially’s free report templates, all the interactive elements are built for you. There’s no coding or tech skills required. In a couple of clicks you can make impressive and impactful slides that illustrate the success of your project or how close you are to reaching your goals.
What’s the best format for reporting?
A high quality report should summarize the results of your business project, giving team members a high level overview and action items for the future. Although we tend to associate reporting with data and finance, project management reports and monthly sales reports are also essential documents for most companies.
At heart, good reporting is all about communication. The best format will help you communicate the main results, project risks, issues, and action plan to key stakeholders.
Genially’s range of free slide decks includes all kinds of customizable resources. Choose from business report templates, annual report templates, project status report templates, interactive projects plans, and financial report templates full of editable charts and animated graphics.
How do I use the report templates?
Genially financial templates give you the framework for a stunning report presentation with the flexibility to customize the slides to your business or department.
Each template includes pre-built visual aids and it’s easy to add images, diagrams and infographics from Genially’s in-built resource bank.
If you work with numbers, try populating the charts and data visualizations with figures imported from your online spreadsheets. Embed your cash flow statement directly in one of the slides. Or illustrate the health of your balance sheet with an interactive diagram that you embed into your weekly, monthly or quarterly reviews.
Work in marketing or business development? Why not illustrate your market research findings with embedded content from the web. Or create an audiovisual report with video and audio to make your message more accessible for everyone.
It’s easy to get started. Choose a design and click Use template. If you haven’t used Genially before you’ll quickly need to sign up for an account (it’s free). Select which slides you want to use and start editing your content.
Once you’ve added the finishing touches, hit Publish. Your report deck is now ready to present live or share with your colleagues, board, or clients. Just share the link in your communication channels, or embed the report on your website or other platforms.